Another Consultation… This time, it’s Space
Just as the ink dries on the Ofsted consultation, up pops another. This time it’s about space, equally important and not to be overlooked. The Department for Education (DfE) has…
October 25th 2024
It delves into Ofsted’s latest data on childcare providers and inspections, shedding light on the growing disparities in access to quality Early Childhood Education and Childcare (ECEC).
While the term ‘childcare deserts’ can evoke a sense of hopelessness, the reality as described in the report is concerning particularly as the gaps are mostly prevalent in deprived areas, leaving many vulnerable children without access to high-quality education and care.
This comes at a time when the UK Government is pushing forward with plans to expand the free childcare entitlement. The use of the term childcare highlights the focus on places which will enable parents to work rather than the language of ECEC which encompasses the wider concept of education and care framed within the quality debate.
The language of childcare is more useful to the notion of expansion of places, detracting the debate from the deeper issues of quality which depends on well trained staff and strong pedagogies. This could be sensible or cynical given the sector remains chronically underfunded, struggles with recruiting and retaining qualified staff, and is seeing rising numbers of children with special educational needs and disabilities (SEND). Added to that are the growing issues of limited support for parents who cannot access the entitlement and thus increasing child poverty. These are long-standing issues that have been discussed for over 20 years. But without a fully-funded, coherent national strategy, it is hard to see how these problems will be effectively addressed.
![]()
Using the Ofsted judgement of ‘Outstanding’ as an indicator of high-quality, they looked at the settings with this rating; in particular, where they are situated. Employing Ofsted data of allocating childcare providers to one of five deprivation bands, the report noted that in the 2022/23 school year 67.2% of children from deprived areas reached a good level of development compared to 76.6% of children in the least deprived areas.
The report may not say this but it begs some further discission:
Nesta provides a table (see below) that shows the top and bottom ten local authorities in England by the number of places available at those providers who were rated ‘Outstanding’ for every 1,000 children aged 0-5. It confirms there are very stark disparities in the availability of high-quality childcare across parts of England.
| Rank | Local authority | Outstanding places for every 1,000 0-5 year olds | Rank | Local authority | Outstanding places for every 1,000 0-5 year olds |
| 1 | Kensington and Chelsea | 104 | 140 | Wolverhampton | 13 |
| 2 | South Tyneside | 94 | 141 | Hartlepool | 12 |
| 3 | Trafford | 92 | 142 | Lincolnshire | 11 |
| 4 | York | 91 | 143 | Croydon | 10 |
| 5 | Cambridgeshire | 84 | 144 | Derby | 10 |
| 6 | Warrington | 84 | 145 | Redcar and Cleveland | 9 |
| 7 | Calderdale | 83 | 146 | Nottingham | 8 |
| 8 | Brighton and Hove | 81 | 147 | Newham | 6 |
| 9 | Westminster | 77 | 148 | Blackpool | 3 |
| 10 | Leeds | 74 | 149 | Rutland | 0 |
At LEYF, where 75% of our settings are situated in areas of deprivation, 46% of our settings are judged ‘Outstanding’ and the rest are ‘Good’. I wondered if the combined strength of our LEYF pedagogy, the support given to our nurseries from the fantastic LEYF pedagogy coaches, and the quality of training at the London Institute of Early Years are our main success factors?
Maybe these areas of deprivation just need the right model, rather than be allowed to feel that it is their inability to drive ‘Outstanding’ that is the issue?
| OFSTED | LEYF | ||||||
| Borough | Total Nurseries | Total Inspected | Outstanding (number) | Outstanding (%) | Total Inspected | Outstanding (number) | Outstanding (%) |
| Barking & Dagenham | 169 | 121 | 11 | 9% | 6 | 1 | 17% |
| Greenwich | 403 | 277 | 29 | 10% | 1 | 1 | 100% |
| Hackney | 241 | 185 | 23 | 12% | 2 | 1 | 50% |
| Hammersmith & Fulham | 144 | 101 | 15 | 15% | 1 | 1 | 100% |
| Kensington & Chelsea | 95 | 66 | 17 | 26% | 2 | 2 | 100% |
| Lambeth | 329 | 229 | 22 | 10% | 2 | 1 | 50% |
| Lewisham | 411 | 287 | 24 | 8% | 3 | 1 | 33% |
| Newham | 207 | 153 | 5 | 3% | 3 | 1 | 33% |
| Richmond upon Thames | 272 | 185 | 26 | 14% | 1 | 0 | 0% |
| Southwark | 341 | 247 | 16 | 6% | 5 | 3 | 60% |
| Tower Hamlets | 178 | 135 | 10 | 7% | 1 | 1 | 100% |
| Westminster | 126 | 92 | 19 | 21% | 8 | 4 | 50% |
| TOTAL | 3,238 | 2,309 | 247 | 11% | 36 | 17 | 47% |
The Nesta report highlights a number of complex issues such as to what we mean by quality, the rights of children in deprived areas to access great ECEC and whether the current plan for expansion will help do anything to change this state of affairs.
Just as the ink dries on the Ofsted consultation, up pops another. This time it’s about space, equally important and not to be overlooked. The Department for Education (DfE) has…
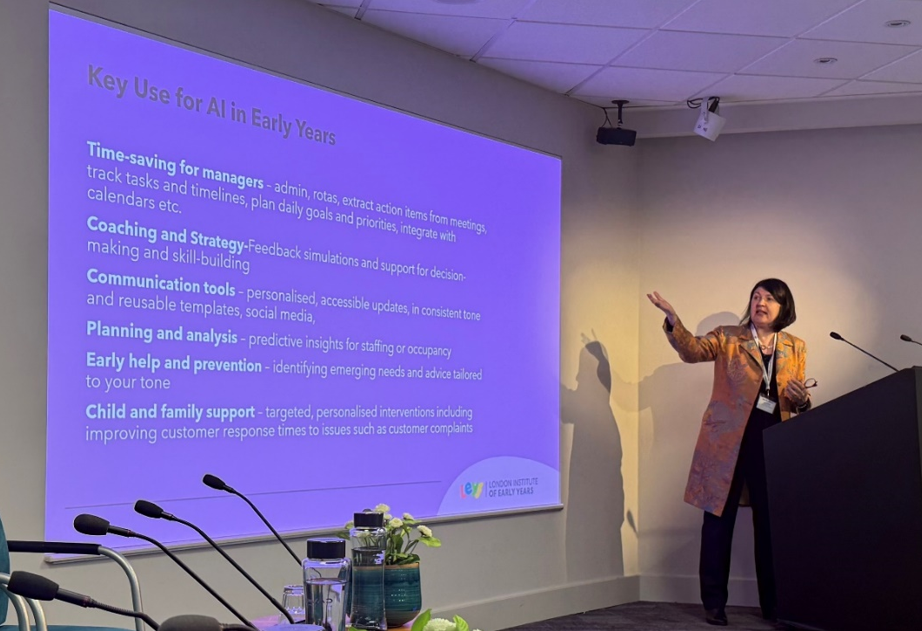
Why read this article? Understand why artificial intelligence is becoming an important issue for the Early Years sector Reflect on the relationship between AI, care and…
Why read this Practical insight for parents worried about screen time and early development Explains how AI and the digital environment shape childhood, not just device…